2026 Funeral Cost Report: Statistics for Every State

Published · Last updated: August 2026
Key funeral cost statistics for 2026
The average U.S. burial costs $10,545 in 2026.
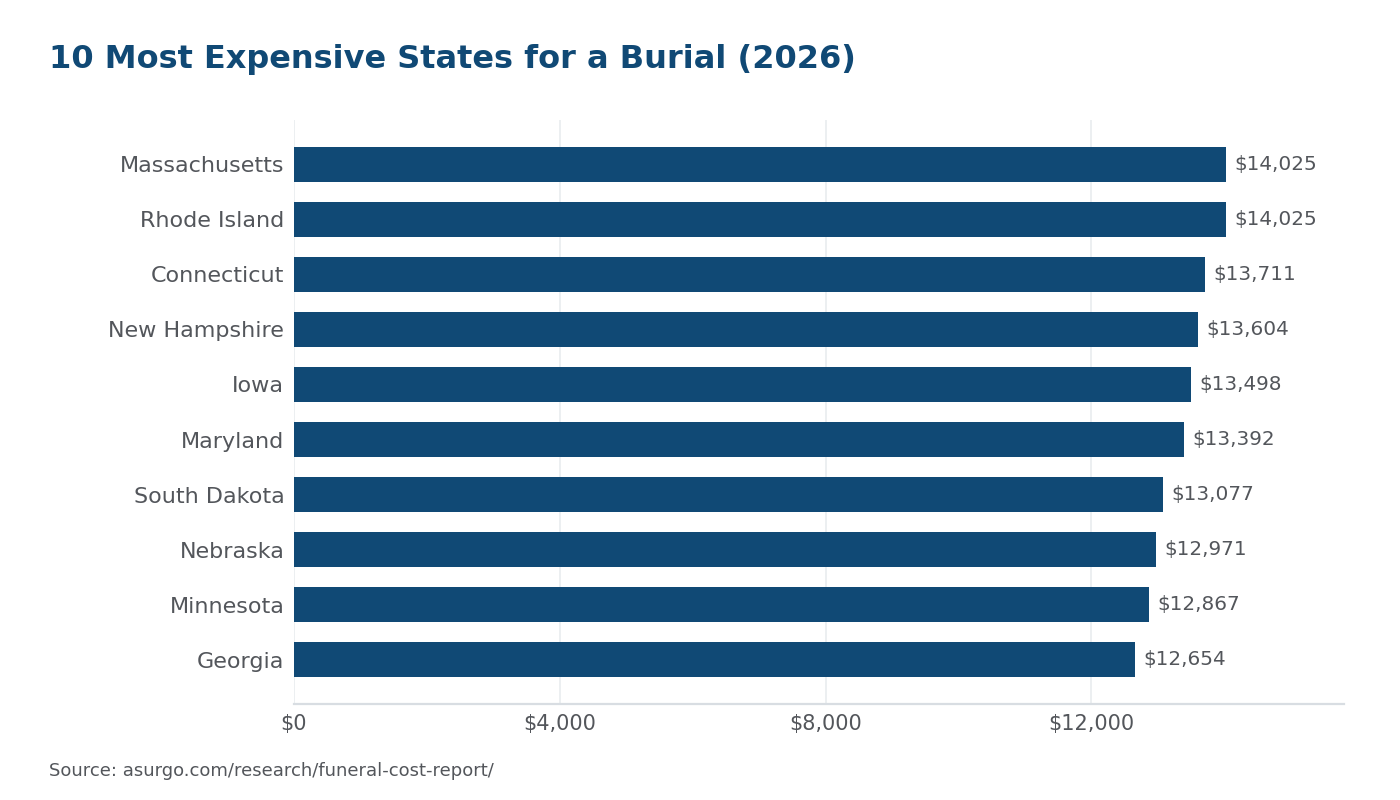
Massachusetts and Rhode Island are the most expensive states for a burial at $14,025.
Washington is the least expensive state at $6,750.
Cremation costs about 40% less than burial in every state.
In Mississippi, an average burial equals 22.1% of median household income, the highest burden in the nation.
A traditional funeral with burial costs families an estimated $10,545 nationally in 2026. But the real figure depends on where you live, and the financial weight it carries depends on what you earn.
- Most expensive states: Massachusetts and Rhode Island top the list at $14,025 for a burial.
- Least expensive state: Washington at $6,750, roughly half the national high.
- Cremation saves an average of $4,140 compared to burial ($6,405 vs. $10,545 nationally).
- Highest burden: In Mississippi, a burial consumes 22.1% of a household's yearly income, the largest share in the country.
- Cost does not equal burden. Mississippi ranks #15 in raw cost but #1 in financial burden due to lower incomes. Massachusetts ranks #1 in cost but #34 in burden.
Below, you will find burial and cremation cost estimates for all 50 states plus Washington, D.C., along with a first-of-its-kind funeral cost burden index that measures how much a funeral weighs against median household income in each state. Use the interactive burial calculator to build an itemized estimate for your state.
Funeral Cost by State: Burial and Cremation Estimates (2026)
Ranked from most expensive to least expensive. Burial estimates include all 17 cost categories: funeral home services, casket, vault, cemetery charges, and day-of expenses. Cremation estimates cover 10 categories including memorial service, urn, and niche plot.
| Rank | State | Burial | Cremation |
|---|---|---|---|
| 1 | Massachusetts | $14,025 | $8,521 |
| 2 | Rhode Island | $14,025 | $8,521 |
| 3 | Connecticut | $13,711 | $8,327 |
| 4 | New Hampshire | $13,604 | $8,264 |
| 5 | Iowa | $13,498 | $8,198 |
| 6 | Maryland | $13,392 | $8,132 |
| 7 | South Dakota | $13,077 | $7,943 |
| 8 | Nebraska | $12,971 | $7,877 |
| 9 | Minnesota | $12,867 | $7,815 |
| 10 | Georgia | $12,654 | $7,686 |
| 11 | Pennsylvania | $12,337 | $7,495 |
| 12 | Illinois | $12,021 | $7,303 |
| 13 | Indiana | $11,916 | $7,237 |
| 14 | New Jersey | $11,916 | $7,237 |
| 15 | Mississippi | $11,704 | $7,111 |
| 16 | Maine | $11,600 | $7,045 |
| 17 | Virginia | $11,389 | $6,917 |
| 18 | Wisconsin | $11,389 | $6,917 |
| 19 | Wyoming | $11,389 | $6,917 |
| 20 | North Dakota | $11,283 | $6,851 |
| 21 | Idaho | $11,179 | $6,789 |
| 22 | Tennessee | $11,074 | $6,728 |
| 23 | Delaware | $10,968 | $6,662 |
| 24 | Louisiana | $10,968 | $6,662 |
| 25 | South Carolina | $10,755 | $6,533 |
| 26 | Texas | $10,651 | $6,471 |
| 27 | District of Columbia | $10,545 | $6,405 |
| 28 | Florida | $10,545 | $6,405 |
| 29 | Hawaii | $10,545 | $6,405 |
| 30 | Alabama | $10,439 | $6,339 |
| 31 | Vermont | $10,439 | $6,339 |
| 32 | Alaska | $10,335 | $6,277 |
| 33 | North Carolina | $10,335 | $6,277 |
| 34 | Kansas | $10,228 | $6,214 |
| 35 | Michigan | $10,228 | $6,214 |
| 36 | Arkansas | $10,122 | $6,148 |
| 37 | Montana | $10,016 | $6,082 |
| 38 | Ohio | $9,807 | $5,959 |
| 39 | Oklahoma | $9,807 | $5,959 |
| 40 | California | $9,701 | $5,893 |
| 41 | Kentucky | $9,386 | $5,702 |
| 42 | New York | $9,386 | $5,702 |
| 43 | Colorado | $9,280 | $5,636 |
| 44 | New Mexico | $9,067 | $5,507 |
| 45 | Utah | $8,965 | $5,447 |
| 46 | West Virginia | $8,965 | $5,447 |
| 47 | Missouri | $8,649 | $5,253 |
| 48 | Oregon | $7,698 | $4,678 |
| 49 | Nevada | $7,486 | $4,546 |
| 50 | Arizona | $7,065 | $4,290 |
| 51 | Washington | $6,750 | $4,100 |
The gap between the most and least expensive states is $7,275. The five least expensive states for a burial are all in the West: Washington ($6,750), Arizona ($7,065), Nevada ($7,486), Oregon ($7,698), and Missouri ($8,649). The five most expensive are concentrated in the Northeast and Upper Midwest.
Burial vs. Cremation: How Much Does Each Cost?
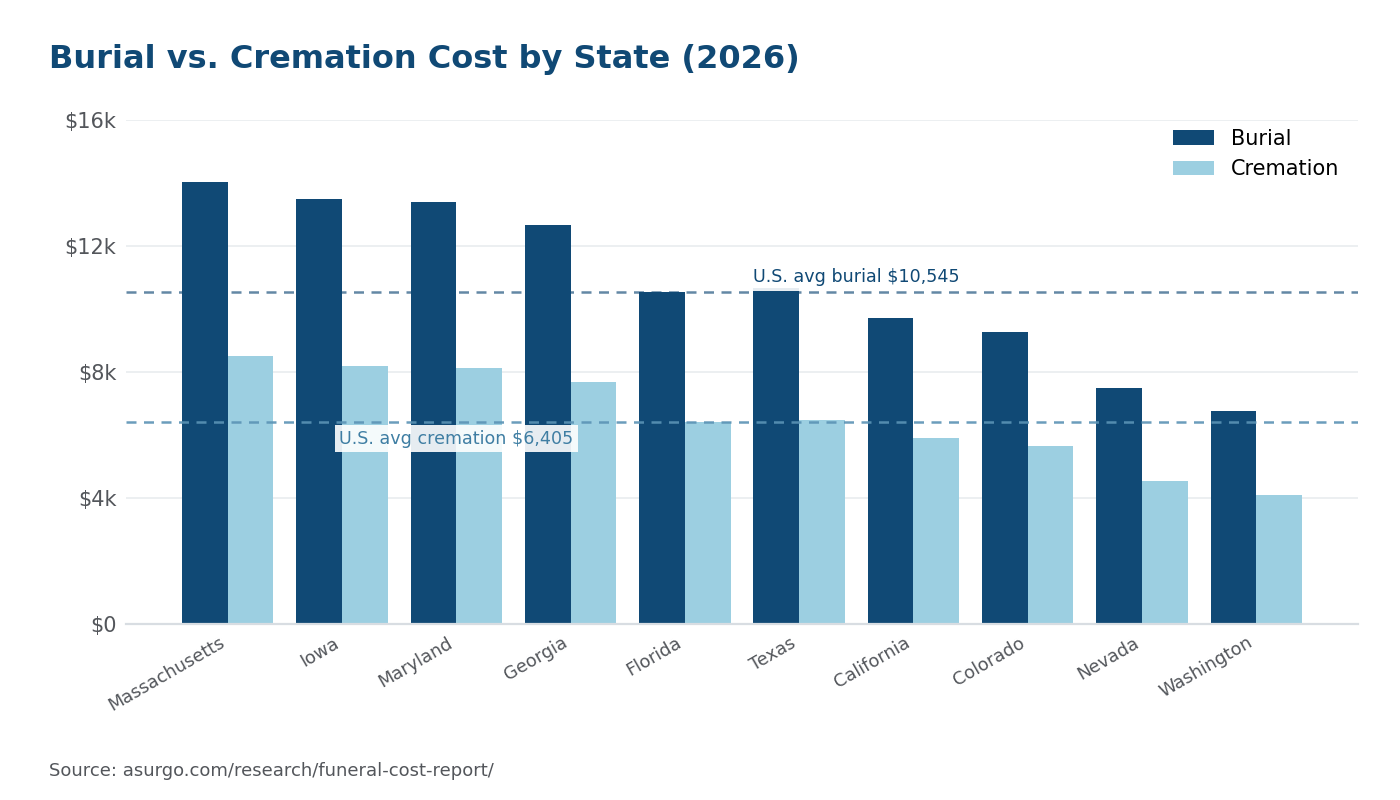
Nationally, cremation with a memorial service runs an estimated $6,405, saving families about $4,140 compared to a traditional burial at $10,545. The cost difference reflects fewer line items: cremation skips the casket ($1,000), burial vault ($1,095), cemetery plot ($700), and grave opening fees ($575) that make up a large share of burial costs.
The savings ratio stays fairly consistent across states. In the most expensive state (Massachusetts), cremation saves families $5,504. In the least expensive state (Washington), the savings is $2,650. Either way, cremation costs roughly 60% of what burial costs.
These cremation estimates include a memorial service, urn, and niche plot. Direct cremation with no service is significantly less, typically under $2,000 nationwide.
See What a Funeral Would Cost in Your State
Use our free calculator to build an itemized burial or cremation estimate based on your state and preferences.
Open the Burial Cost Calculator Or call (855) 380-9555Funeral Cost Burden Index: Where Funerals Hit Hardest
A $10,000 funeral means something different in Mississippi than in Massachusetts. To capture that difference, we built a funeral cost burden index: the estimated burial cost divided by the state's median household income. The result shows what percentage of a family's annual income goes to paying for a funeral.
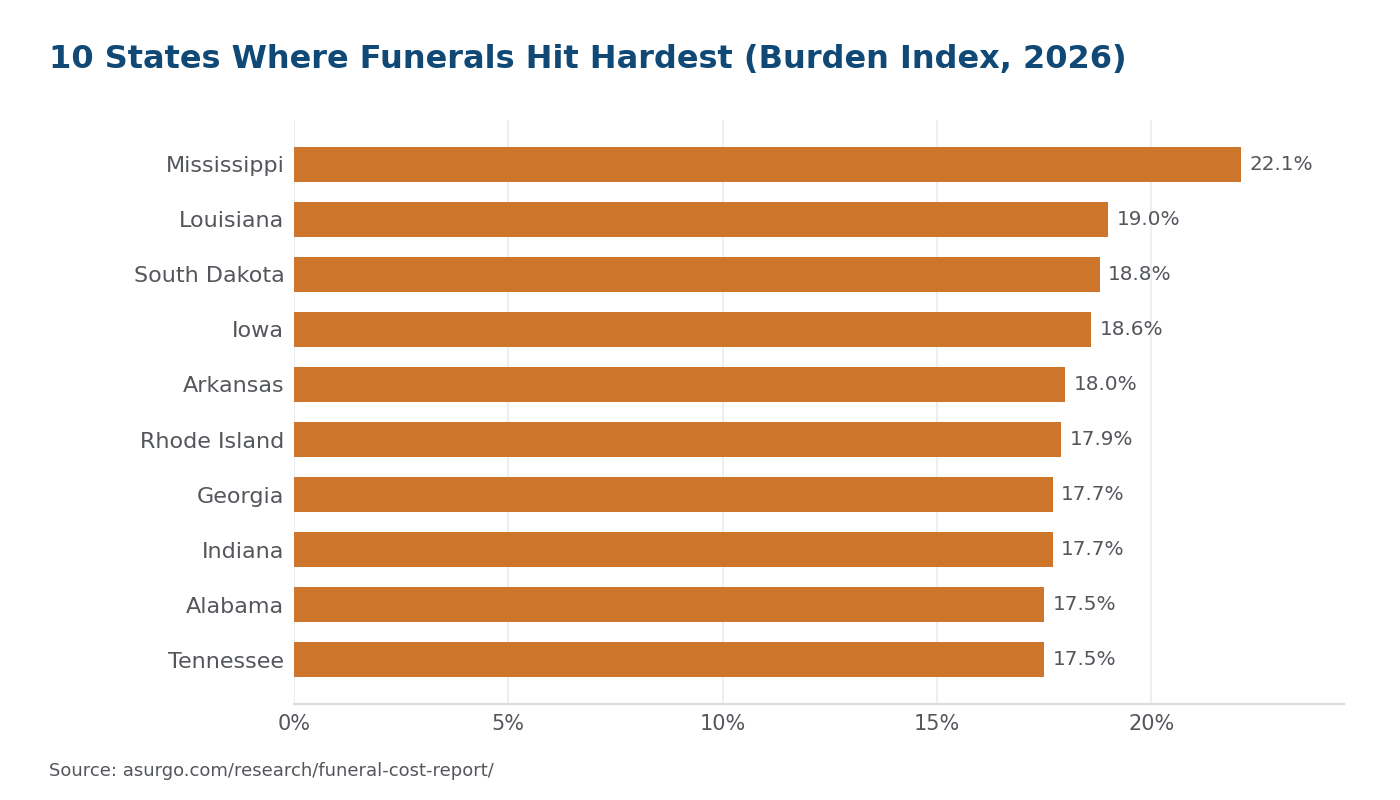
The burden index reveals a pattern the raw cost table hides. Mississippi ranks only #15 in raw burial cost ($11,704) but jumps to #1 in burden because the state's median household income is just $52,985. West Virginia tells a similar story: #46 in cost but #12 in burden. Meanwhile, Massachusetts ranks #1 in cost but drops to #34 in burden because its median household income ($96,505) absorbs the expense more easily.
These divergences matter for families planning ahead. If you live in a high-burden state, the financial impact of an unplanned funeral is magnified, and preplanning or life insurance coverage becomes more important.
Funeral Cost Burden Index by State (2026)
Ranked from highest to lowest burden. The burden column shows burial cost as a percentage of annual household income. The monthly column shows what percentage of a single month's income the burial would consume.
| Rank | State | Burden | Monthly | Income |
|---|---|---|---|---|
| 1 | Mississippi | 22.1% | 265.1% | $52,985 |
| 2 | Louisiana | 19.0% | 227.5% | $57,852 |
| 3 | South Dakota | 18.8% | 225.9% | $69,457 |
| 4 | Iowa | 18.6% | 223.6% | $72,429 |
| 5 | Arkansas | 18.0% | 215.6% | $56,335 |
| 6 | Rhode Island | 17.9% | 214.8% | $78,364 |
| 7 | Georgia | 17.7% | 212.8% | $71,355 |
| 8 | Indiana | 17.7% | 212.9% | $67,173 |
| 9 | Alabama | 17.5% | 210.1% | $59,609 |
| 10 | Tennessee | 17.5% | 210.6% | $63,109 |
| 11 | Nebraska | 17.4% | 208.7% | $74,580 |
| 12 | West Virginia | 17.1% | 204.8% | $52,520 |
| 13 | Pennsylvania | 16.9% | 202.3% | $73,170 |
| 14 | South Carolina | 16.9% | 202.9% | $63,623 |
| 15 | Maine | 16.1% | 193.8% | $71,832 |
| 16 | Oklahoma | 16.0% | 191.8% | $61,364 |
| 17 | Wisconsin | 15.7% | 188.6% | $72,458 |
| 18 | Wyoming | 15.7% | 188.5% | $72,495 |
| 19 | North Carolina | 15.6% | 187.4% | $66,186 |
| 20 | Florida | 15.5% | 186.3% | $67,917 |
| 21 | Kentucky | 15.5% | 186.5% | $60,407 |
| 22 | New Mexico | 15.4% | 185.3% | $58,722 |
| 23 | Idaho | 15.3% | 183.9% | $72,936 |
| 24 | Illinois | 15.3% | 183.9% | $78,433 |
| 25 | Michigan | 15.3% | 183.2% | $66,986 |
| 26 | Minnesota | 15.3% | 183.1% | $84,313 |
| 27 | North Dakota | 15.3% | 183.1% | $73,959 |
| 28 | Ohio | 15.3% | 183.8% | $64,018 |
| 29 | Connecticut | 15.2% | 182.4% | $90,213 |
| 30 | Montana | 15.2% | 182.1% | $66,017 |
| 31 | New Hampshire | 15.0% | 179.7% | $90,845 |
| 32 | Delaware | 14.6% | 174.8% | $75,305 |
| 33 | Texas | 14.6% | 175.0% | $73,035 |
| 34 | Massachusetts | 14.5% | 174.4% | $96,505 |
| 35 | Kansas | 14.4% | 172.9% | $70,999 |
| 36 | Vermont | 14.1% | 169.2% | $74,014 |
| 37 | Maryland | 13.6% | 163.2% | $98,461 |
| 38 | Missouri | 13.1% | 157.4% | $65,920 |
| 39 | Virginia | 13.1% | 156.6% | $87,249 |
| 40 | New York | 12.5% | 149.9% | $75,157 |
| 41 | New Jersey | 12.3% | 147.2% | $97,126 |
| 42 | Alaska | 12.0% | 143.6% | $86,370 |
| 43 | Hawaii | 11.1% | 133.5% | $94,814 |
| 44 | Nevada | 10.8% | 129.3% | $69,486 |
| 45 | California | 10.6% | 126.7% | $91,905 |
| 46 | Colorado | 10.6% | 127.1% | $87,598 |
| 47 | District of Columbia | 10.4% | 125.3% | $101,027 |
| 48 | Utah | 10.3% | 123.9% | $86,833 |
| 49 | Oregon | 10.1% | 121.0% | $76,362 |
| 50 | Arizona | 9.7% | 116.8% | $72,581 |
| 51 | Washington | 7.5% | 89.7% | $90,325 |
Methodology
The figures in this report are estimates, not the results of a consumer poll or pricing database. They are built from a defined, reproducible process:
Data Sources
- Funeral home charges. Asurgo collected and analyzed General Price Lists (GPLs) from more than 1,000 funeral homes across all 50 states. GPLs are federally mandated disclosures under the FTC Funeral Rule. From this dataset we derived a national median for each funeral home service line item, plus a state-level multiplier that captures how much higher or lower each state's prices run compared to the national median.
- Cemetery and cash-advance items. Items like cemetery plots, opening-and-closing fees, vaults, headstones, flowers, and reception catering are not covered by GPLs. For these categories, national medians are drawn from NFDA member data and state funeral-board reports.
- Household income. Median household income figures come from the U.S. Census Bureau American Community Survey (ACS), 2023 1-year estimates, table S1901.
How State Estimates Are Calculated
Each state's burial estimate is the sum of 17 individual cost items (funeral home services, cemetery charges, and day-of expenses), each multiplied by the state's GPL-derived multiplier and rounded to the nearest dollar. Cremation estimates use 10 items and the same multiplier. The formula: State item cost = round(national median item cost x state multiplier).
How the Burden Index Works
The funeral cost burden index is: (estimated burial cost / median household income) x 100. The result is the percentage of a household's annual income consumed by a single burial. A higher number means the funeral is harder for a typical family to absorb.
Why These Numbers Differ from NFDA Figures
The NFDA's widely cited "median cost of a funeral" ($8,300 range in recent reports) covers only funeral home charges. This report adds cemetery and cash-advance items to reach a true all-in cost. That explains the higher national figure of $10,545. The two datasets are not in conflict; they measure different scopes.
Notable State Patterns
California ranks #40 in raw cost despite a high cost of living. This reflects a cremation rate above 75%, which pushes traditional funeral home pricing lower relative to other states. Mississippi ranks #15 in raw cost but #1 in burden because of the nation's lowest median household income ($52,985). These kinds of divergences are the reason the burden index exists.
Limitations
State multipliers are derived from GPL data that skews toward funeral homes with published price lists. Rural funeral homes with no online GPL may be underrepresented. DC and Hawaii use a 1.00 fallback multiplier due to insufficient price list volume. Household income is a broad proxy for financial capacity; individual circumstances vary widely. These are planning estimates, not quotes.
Data is published under CC BY 4.0. Cite as: Asurgo, "2026 Funeral Cost Report," asurgo.com/research/funeral-cost-report/.
Cite this report
This data is free to reference. Please link to this page as the source.
Frequently Asked Questions
How much does a funeral cost in 2026?
The national median all-in funeral with burial costs an estimated $10,545 in 2026, including funeral home services, casket, vault, cemetery charges, and day-of expenses. Cremation with a memorial service runs about $6,405. State estimates range from $6,750 in Washington to $14,025 in Massachusetts.
What state has the most expensive funerals?
Massachusetts and Rhode Island have the highest estimated funeral costs at $14,025 for a burial, followed by Connecticut ($13,711), New Hampshire ($13,604), and Iowa ($13,498). The Northeast dominates the top of the list.
Is cremation cheaper than burial?
Yes. Nationally, cremation with a memorial service costs an estimated $6,405, about $4,140 less than burial at $10,545. The gap holds across all 50 states and DC. Direct cremation (no service) is even less, typically under $2,000.
How were these funeral cost estimates calculated?
These are estimates, not the results of a poll. Asurgo analyzed more than 1,000 funeral home General Price Lists across 50 states. State multipliers derived from that dataset are applied to median national cost figures for funeral home services, cemetery charges, and day-of expenses. Income data comes from the U.S. Census Bureau ACS table S1901. See the full methodology for details.
Ready to Protect Your Family from These Costs?
Final expense insurance covers funeral costs so your family does not have to. We shop 25+ carriers to find the best rate for your age and health. No obligation, no pressure.
Get a Free Quote Or call (855) 380-9555
Nicholas Norminton
Nicholas is a nationally licensed insurance specialist who has helped thousands of families plan for final expenses. He built Asurgo into an independent brokerage serving all 50 states with access to 25+ carriers. This report is part of Asurgo's ongoing commitment to giving families the data they need to make informed decisions.
Sources
- National Funeral Directors Association (NFDA). Statistics on funeral costs. nfda.org
- U.S. Census Bureau. American Community Survey 2023, 1-year estimates, table S1901: Income in the Past 12 Months. data.census.gov
- Federal Trade Commission. The FTC Funeral Rule: Mandatory price disclosures by funeral providers. ftc.gov
- Bureau of Labor Statistics (BLS). Consumer Expenditure Surveys, funeral and burial services. bls.gov